Learn about the Fibonacci tool on the AS-HOM cTrader
What is the Fibonacci tool?
The Fibonacci tool is an improved tool used in chart analysis, and it differs from the traditional lines in the ability to slope and sentiment. The Fibonacci tool enables the user to draw a set of trend lines and set future price targets, taking into account the directional inclination angle.
What does the Fibonacci tool consist of?
The Fibonacci tool consists of two extreme points (from the first point to the second point in the same direction) If the trend is up, the lower points are connected to create the first line which becomes the primary support while moving the second line and in the case of a downtrend, the upper points are connected to create the line The first that becomes the primary resistance when the second line is moved. The location of the rest of the lines can be modified accordingly
What are Fibonacci levels?
Fibonacci levels are used to predict price movement in technical analysis tools. These levels are based on the series of numbers consisting of the sum of the two previous numbers in the sequence: 0, 1, 1, 2, 3, 5, 8, 13, 21, 34, 55, ... Dividing any number in the sequence by the previous number gives approximately value of 1.61. This value is used as a key factor in creating the graphical Fibonacci tools.
What are Fibonacci levels made of?
The Fibonacci tool is one of the most important and popular tools in technical analysis. It consists of a network of lines that are located at distances calculated by the Fibonacci ratio. These lines are key price levels, as the price tends to interact with them and often changes direction when approaching them.
Conversely, breaching these levels indicates a strong trend in the market. Fibonacci tools help traders to identify potential support and resistance levels and predict future price movement.
What are the trading strategies using Fibonacci levels?
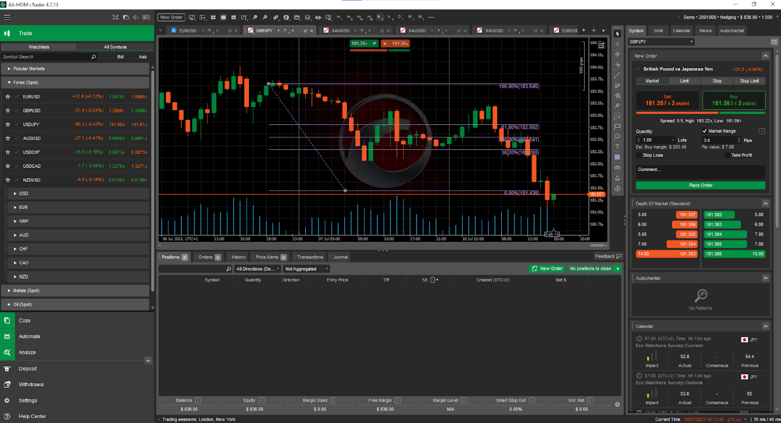
The grid extends from level 100 (end of trend) to level 0 (beginning of trend) over the course of the trend. Levels within this range are reference points for a possible price correction while levels above 100 (eg 161.8, 261.8, etc.) and levels below 100 (eg 61.8, 38.2, etc.) are considered continuous levels for the continuation of the price trend.
Fibonacci levels on the charts:
- 23.6%
- 38.2%
- 50.0%
- 61.8%
- 100.0%
The levels of 38.2% and 61.8% are the most popular and are usually used as support and resistance levels.
When you open a position in the direction of the price towards the internal levels, you can set the stop loss and set the take profit points. When trading within a correction, the internal levels can be the pre-determined targets. You can also open deals when the level is broken and set pending orders at those levels.
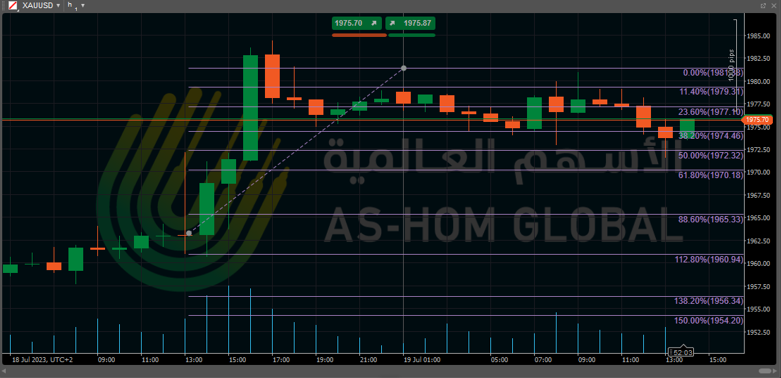
What are arcs in Fibonacci?
Fibonacci arcs are an effective tool in analyzing the price movement during periods of stability and are used to identify corrections in the price, like other Fibonacci indicators. The arcs extend from the initial point to the final point of a trend or wave. The arcs can be constructed from beginning to end, and from end to beginning. These directions are only indicators of the general direction based on slope.
In the chart, the classic Fibonacci arcs tool has only three arcs within the range of the original trend. As the price moves away from the key points, the lines move away from each other and the target range expands slightly.
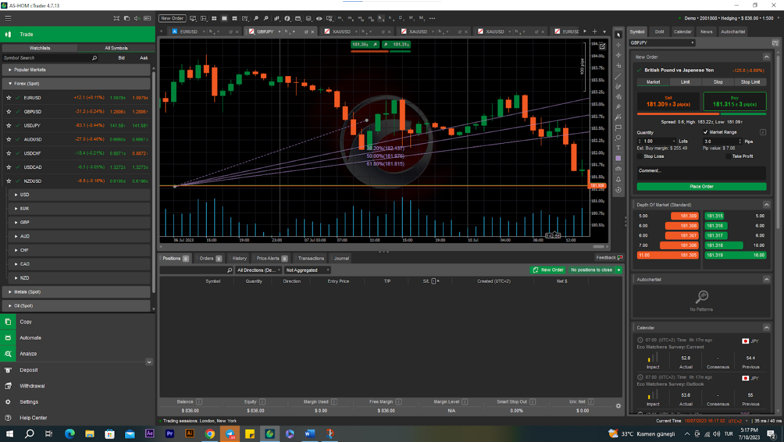
What is the Fibonacci fan?
The Fibonacci Fan is a technical analysis tool used to identify support and resistance levels and analyze price action, The Fibonacci Fan is based on the concept of Fibonacci levels and relies on Fibonacci ratios to identify potential targets and areas of potential support and resistance.
The Fibonacci fan consists of a horizontal line drawn on the first point (the starting point) and extending to the second point (the endpoint), then perpendicular lines are drawn based on the famous Fibonacci ratios (23.6%, 38.2%, 50%, 61.8%, 78.6%) which Represent potential resistance and support levels.
When using the Fibonacci fan, it is noted that the higher levels represent potential resistance levels, while the lower levels represent potential support levels. It is believed that when the price of an asset trades near these levels, it can signal possible changes in the price direction or a trend reversal.
It is important to note that the Fibonacci fan does not provide specific timing indicators but rather ranges where changes in price action can occur. Trend analysis and other technical indicators are used to make more predictions about price action based on the Fibonacci Fan.
Some examples of popular Fibonacci extensions:
Extension Levels: Allow traders to set additional levels after the original points on the chart. This extension is used to identify potential support and resistance levels for future price forecasts.
Fibonacci Fan: works as a set of orthogonal lines based on Fibonacci ratios. They are used to identify potential support and resistance areas and future price directions.
Retracement Levels: They are used to identify potential support and resistance levels when correcting the main price trend. These levels can be used to identify potential entry and exit points.
The Bar (Fibonacci Arc): This extension is used to identify potential support and resistance based on orthogonal levels of Fibonacci ratios. It can help determine future price trends.
These extensions serve as additional tools that help clarify forecasts and improve accuracy in price analysis using Fibonacci levels. They are commonly used in technical analysis and trading in the financial markets.
Fibonacci Pros and Cons
Fibonacci levels are a popular technical analysis tool used to identify support and resistance levels and price action predictions. But like any analytical tool, it has its pros and cons that need to be taken into account. Here are some of the potential pros and cons:
Positives:
Provide support and resistance levels: Fibonacci levels help identify potential support and resistance areas in price action, enabling traders to identify potential entry and exit points.
Re-trade signals: Some believe that Fibonacci levels can provide signals for re-trade operations, as prices can bounce back from Fibonacci levels after corrections.
Setting Profit Targets: Fibonacci levels can be used to set potential profit targets for trades, enabling traders to identify potential exit points.
Negatives:
Overlapping signals: There may be an overlap between different Fibonacci levels, which makes it difficult for traders to identify the most important levels and use them effectively.
Absolute imprecision: Fibonacci levels are not a 100% accurate indicator, and price action may fluctuate around or exceed these levels.
History dependence: Fibonacci levels may be based on historical data and therefore may not be absolutely applicable to current or future events.
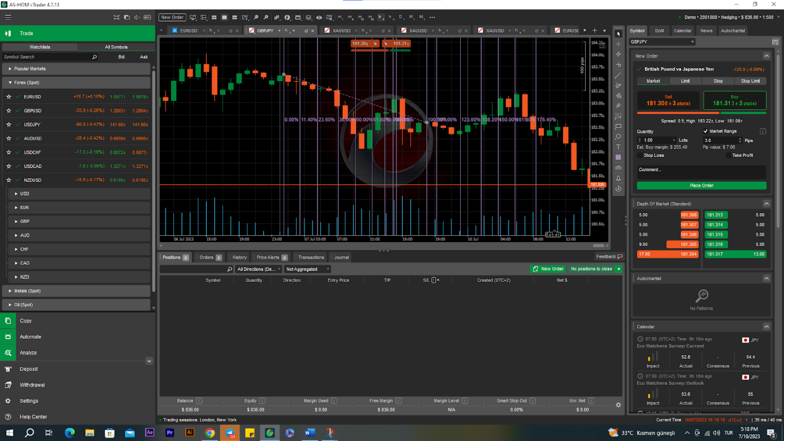
What is the time zone in Fibonacci?
The time zone in the Fibonacci theory refers to a set of key levels derived from the Fibonacci number sequence, which is a series of numbers that usually begin with the numbers 0 and 1, and each number in the series is calculated by adding the two previous numbers in it (for example 0, 1, 1, 2, 3, 5, 8, etc.).
In the context of trading and analyzing financial markets, traders and analysts use the Fibonacci time zone to identify potential support and resistance levels on price and times charts. These levels depend on certain ratios derived from the Fibonacci time series, such as the ratio of 0.382, 0.500, 0.618, etc.
What are Fibonacci extensions and how can they be configured and used in trading?
Calculating Fibonacci Bands: The indicator calculates and draws Fibonacci bands based on the chosen moving average, These bands originate from Fibonacci levels (such as 0.0%, 38.2%, 61.8%, or others) and extend above and below the moving average by factor.
Configure moving average: customize the type of moving average (such as simple average, synthetic average, etc.) and the number of periods used in the calculation. The moving average acts as the basis for the Fibonacci bands.
Alert function: The indicator provides various alert options to notify traders of specific events. This includes price level alerts and approach alerts.
Price Level Alerts: Configure the indicator to trigger alerts when the price touches specific Fibonacci levels. Alerts can be based on the closing price or when the price directly touches the level.
Approach Alerts: Set up Approach Alerts to receive notifications when the price approaches or moves away from a specified Fibonacci level within a certain distance. Alerts can be triggered when the price approaches or moves away from a level.
Alert output options: Choose from sound alerts, pop-ups, Telegram messages, and email notifications for alerts, Audio alerts can be customized by selecting different audio files.
Visualization Options: Customize the visualization of Fibonacci levels with options such as displaying percentage values, specifying a color for percentage labels, controlling label location on the chart, enabling/disabling specific bars, and choosing the color, thickness, and appearance of the bars.
Configurable Fibonacci levels: Modify the specific Fibonacci levels used in the calculation according to your trading strategy. Positive and negative Fibonacci levels can be customized individually.
Conclusion
In summary, the Fibonacci indicator combines Fibonacci analysis and moving averages to help identify potential support and resistance levels, With configurable alert functions and visualization options, it is an indispensable tool for traders who rely on Fibonacci retracement or expansion strategies.


